Modelling threshold-dependent economic closures
Source:vignettes/thresholded_response.Rmd
thresholded_response.Rmd
library(daedalus)
library(data.table)
#>
#> Attaching package: 'data.table'
#> The following object is masked from 'package:base':
#>
#>     %notin%
library(ggplot2)

response_threshold <- 1000
Initially run the model with no response, and then with an elimination response activated when total hospitalisations reach 1000 or after 30 days, whichever is sooner.
canada <- daedalus_country("CAN")
canada$hospital_capacity <- response_threshold

data_baseline <- daedalus(
  canada,
  daedalus_infection("influenza_1918", rho = 0.0), # prevent re-infection
  response_strategy = "none",
  time_end = 200
)

# get the model timeseries
data_baseline <- get_data(data_baseline)
data_baseline$scenario <- "no_response"
# run the model with a heavy elimination intervention
data_intervention <- daedalus(
  canada,
  daedalus_infection("influenza_1918", rho = 0.0), # prevent re-infection
  response_strategy = "elimination",
  time_end = 200
)

# get the model timeseries
data_intervention <- get_data(data_intervention)
data_intervention$scenario <- "elimination"
Note that the default duration of a pandemic
response in daedalus is 365 days. This duration applies from
the time of the first response trigger. That is, if a model is set up
such that a response is mandated from day 30, the response will end on
day 30 + 365 = 395 by default.
However, if the response begins earlier than the
response_time due to hospital capacity being breached, the
duration applies from this earlier time. In this scenario, the start and
end times of the response can only be known by running the model. The
response duration will still be the value passed to
response_duration (or the default if no specific value is
passed).
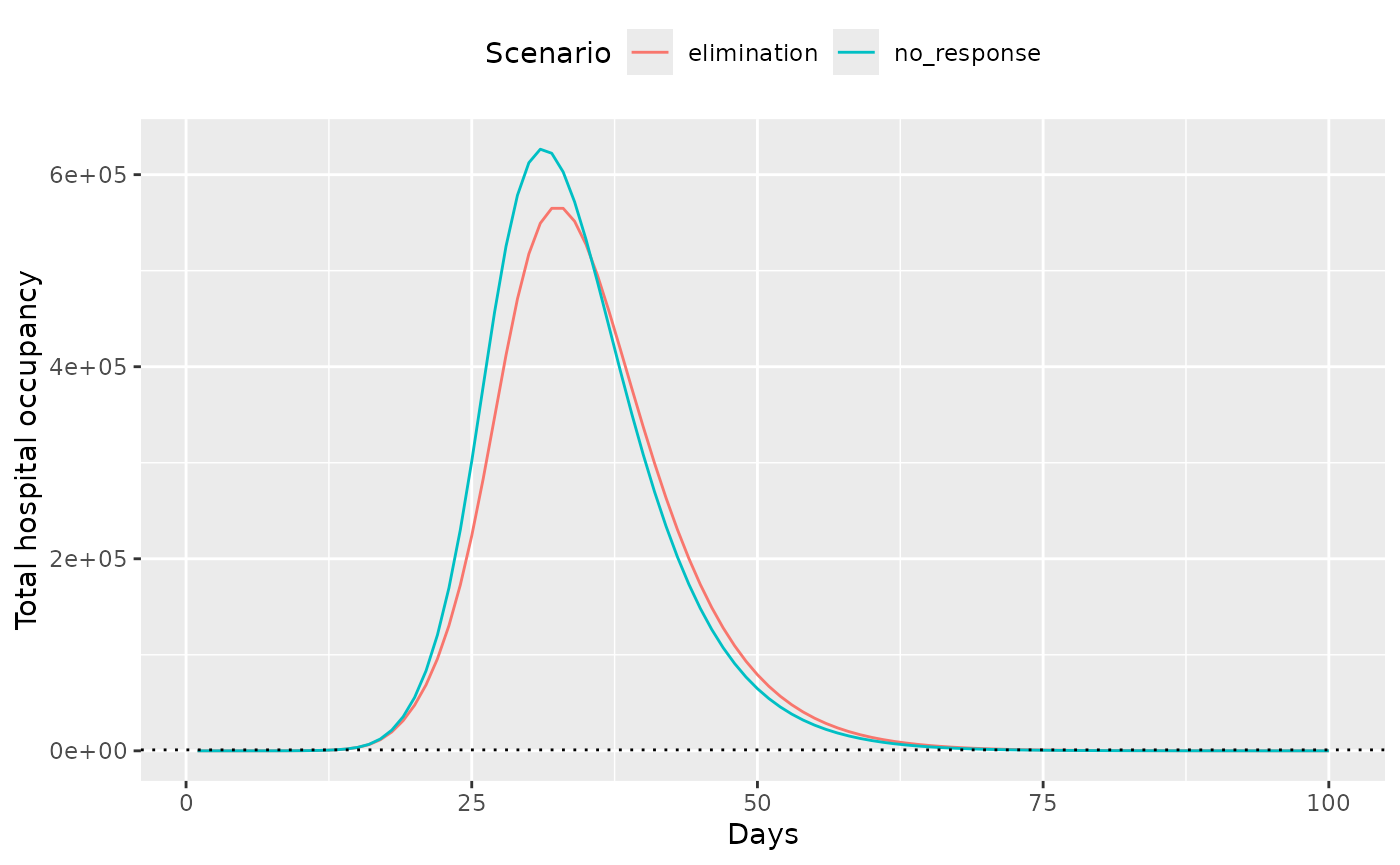
Plot the total hospital occupancy for both scenarios to view the effect of interventions.
# sum over age and econ strata as total is more relevant
data <- data[
  compartment %like% "hospitalised", .(value = sum(value)),
  by = c("time", "scenario")
]

# check actual outcomes of interest - these don't look as good
ggplot(data) +
  geom_line(aes(time, value, colour = scenario)) +
  geom_hline(
    yintercept = response_threshold, linetype = "dotted"
  ) +
  labs(y = "Total hospital occupancy", x = "Days", col = "Scenario") +
  theme(legend.position = "top")